PROJECT MANAGER ESSENTIALS
PROJECT MONITORING AND CONTROL
Once the Project is planned, monitoring the progress of the project and controlling all the deviations from the desired goal takes place. Hence communication, risk, schedule, costs are all tracked. The change management process and defect tracking is an essential part of this phase.
The phase also goes in parallel with the execution of the project.
This process is essential to prevent scope creep. It deals with communicating with the stakeholders and continuously recording the feasible changes that occur.
Scope, costs and schedule control along with customer satisfaction can be the winning elements in a project.
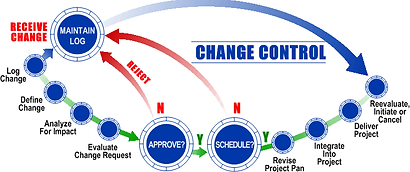
CHANGE MANAGEMENT
STATUS AND PROGRESS REPORTING
The Project sponsor, team members and all the important stakeholders that require information about the progress of the project should be part of the distribution list. The report must contain:
-
Progress since last report
-
Current status- Scope, cost and time
-
Issues and actions taken
-
Actions to be taken in the future
PEOPLE ISSUES
QUALITY CHECKS
MILESTONES
TOOLS FOR MONITORING PERFORMANCE
-
Tracking and baseline Gantt chart
They are used to track the difference between the planned and the actual schedule. Software like MS Project can be used for this.

-
Control charts
It monitors the past and current schedule performance of the project.
Projects are monitored through milestones.
A guide for making control charts: https://www.isixsigma.com/tools-templates/control-charts/a-guide-to-control-charts/
It is important that the proper milestones and critical points are identified in the planning phase.

-
S-curves
These are typically curves representing difference in the cumulative actual and planned costs and schedule of the projects. These can be easily visualised hence serve a great way of tracking.
-
Earned Value Management
In this method, cost and schedule baselines are set and the variances are calculated over time. This efficiently helps in controlling project performance.
It includes components from Control charts and S curves.
Some important terms associated are:

The different steps in integrating the cost/schedule system to compute variances ( Gray and Larson, 2014):
1. Define the work using a WBS
-
Scope
-
Work packages
-
Deliverables
-
Organization units
-
Resources
-
Budgets
2.Develop work and resource schedules
-
Schedule resources to activities
-
Time-phase work packages into a network
3. Develop a time-phased budget using work packages included in an actvity. Accumulate budgets (PV)
4. At the work package level, collect the actual costs for the work performed (AC).
Earned value (EV) = percent complete * original budget
5. Compute the schedule variance (EV-PV) and the cost variance (EV-AC)